00 Data science company

Statnu — Data science for a better world.

We use the power of data to solve the world’s most pressing problems. Mathematics, statistics, and computer science — in service of people.

Talk to our data team

Healthcare · Finance · Retail. Mutual NDA before the first dataset.

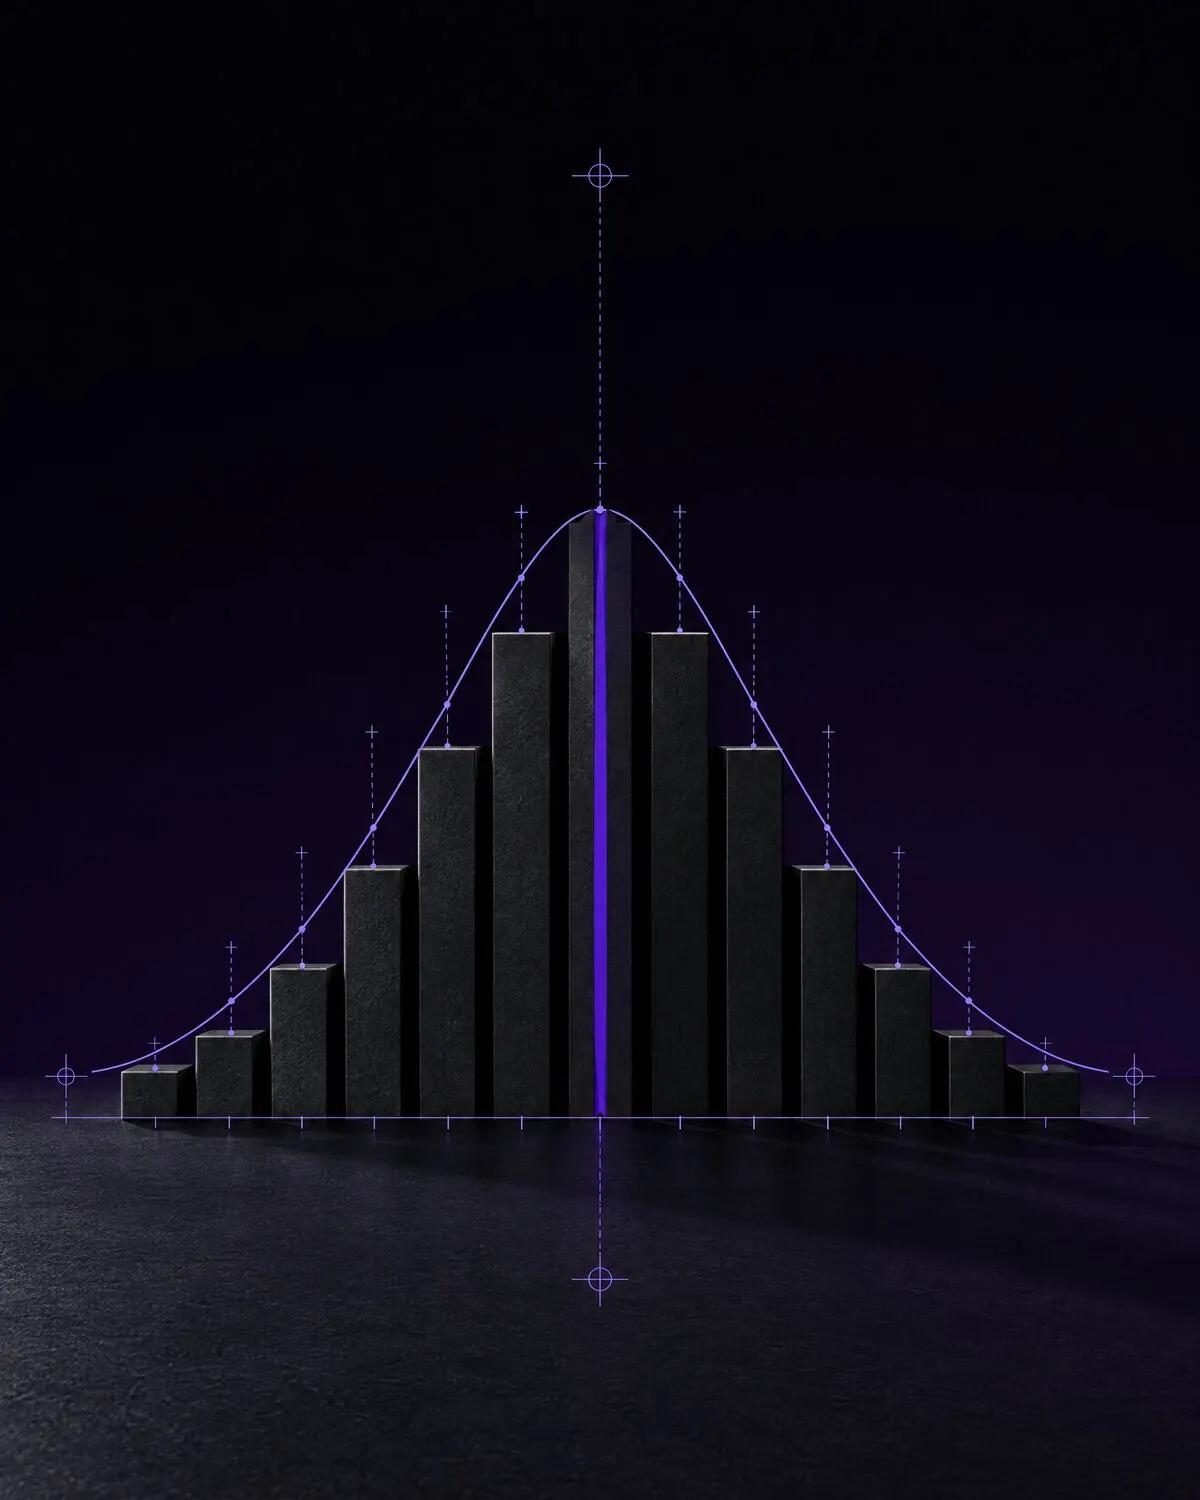
Black stone histogram bars rising in a bell curve, the central bar split by a thin violet plane, with a lavender distribution curve drawn over their tops.
Fig. 01 Signal, separated from noise.

01 What we believe

Data is the new oil. Like oil, it is worth nothing unrefined.

02 Services

Nine services.
One standard of rigour.

Every engagement ends with something you can use and defend: a validated model, a reproducible analysis, a pipeline that runs.

Nine black sculptural data objects in a row — a pie chart, a bar chart, a database stack, a scatter plate, a line graph, a bell curve, a lattice cube, a violet-edged ring and a slab — each with lavender dimension lines.
Fig. 02 Nine instruments, one method.
01

Data Science Consulting

End-to-end data science strategy and delivery for complex business problems, from framing the question to putting the answer into production.

Problem framing, delivery roadmap, production-ready solution.

02

Predictive Analytics

Forecasting and predictive modelling powered by statistics and machine learning.

Forecast models, accuracy benchmarks, monitoring plan.

03

Machine Learning Solutions

Custom ML models built by mathematicians, statisticians and computer scientists, tailored to your problem and your data.

Trained, documented models with validation reports.

04

Data Engineering

Reliable data pipelines and infrastructure, so every analysis rests on data you can trust.

Pipelines, data model, automated quality checks.

05

Statistical Modelling

Rigorous statistical analysis for confident decision-making, with uncertainty stated rather than hidden.

Reproducible analysis, effect sizes, confidence intervals.

06

Healthcare Analytics

Using data to improve outcomes in healthcare, from patient flow to clinical risk.

Outcome models, privacy-compliant data handling.

07

Financial Analytics

Data-driven insight for finance and risk: credit, fraud, liquidity and portfolio analysis.

Risk models, explainability documentation.

08

Retail Analytics

Understanding customers and operations through data: demand, pricing, assortment and churn.

Demand forecasts, customer segments, pricing tests.

09

Data Strategy & Advisory

Helping organisations turn data into impact: priorities, governance, team and roadmap.

Data strategy, use-case portfolio, governance model.

Talk to our data team

03 Our process

Understand. Explore. Model.
Validate. Deliver.

A dense cloud of lavender points passes through five black panels with narrow slits, becoming more ordered at each one and leaving as a single smooth violet curve.
  1. 01

    Understand

    1–2 weeks

    We dig into your problem and your data: the decision it serves, the sources, the constraints.

    Output Problem statement and data audit.

  2. 02

    Explore

    2–3 weeks

    Statistical analysis and data exploration. We find out what the data can and cannot say.

    Output Exploratory report and baseline.

  3. 03

    Model

    3–6 weeks

    Predictive and machine-learning modelling, starting simple and adding complexity only when it earns its place.

    Output Candidate models compared against the baseline.

  4. 04

    Validate

    1–3 weeks

    Rigorous testing on data the model has never seen, including checks for bias and drift.

    Output Validation report and model card.

  5. 05

    Deliver

    Ongoing

    Insights, models and measurable impact, handed over with documentation or run with you in production.

    Output Deployed model, dashboards, impact measurement.

Why choose Statnu

  1. Experts in mathematics, statistics and computer science. Every project is staffed by people trained in all three.
  2. A proven track record. Complex problems solved with data, measured against a baseline.
  3. Cross-industry experience. Healthcare, finance and retail, and the methods that travel between them.
  4. A more just, equitable and sustainable world. We test our models for bias and choose work that makes a difference.
  5. Data is the new oil — we help you use it. Collected data has no value until it informs a decision.

04 Results

What rigour is worth, measured.

Models and analyses delivered into production across healthcare, finance and retail.

Five black blocks ascending in height beside a lavender measurement scale, joined by a dotted trend line; the tallest block is edged in violet.
18%
average reduction in forecast error against the client’s existing baseline.
8 weeks
typical time from first dataset to a validated model.
3 sectors
of deep experience: healthcare, finance and retail.
100%
of models delivered with documentation and a validation report.

Figures across completed engagements. Methodology available under NDA.

05 Case studies

Four problems,
solved with data.

Clients are not named. The numbers are theirs.

A raised black heartbeat waveform lying on a lavender grid like medical chart paper; one peak is traced in violet.

Healthcare · regional hospital network · 6 sites

Readmissions predicted early enough to prevent them.

Problem
Unplanned 30-day readmissions were rising, and clinicians had no reliable way to tell which patients were at risk at discharge.
What we did
Linked admission, diagnosis and discharge data; built and validated a readmission-risk model; designed a discharge checklist around it with clinical staff.
Result
30-day readmissions down 17% in the first year. Model audited for bias across age, sex and postcode.

Retail · grocery chain · 240 stores

Demand forecasts that cut waste instead of guessing it.

Problem
Store ordering relied on last year’s sales. Fresh-food waste was high and shelves still ran empty at weekends.
What we did
Pipeline from point-of-sale and supply systems, store-and-product demand forecasting with weather and promotion effects, ordering recommendations.
Result
Fresh-food waste down 21%, stock-outs down 30%. Forecast error 24% below the previous method.
A grid of black boxes of varying heights like a demand heatmap, with a lavender forecast curve floating above; one box is outlined in violet.
Black candlestick-chart bars with lavender wicks standing in front of a fine grid; one candlestick is outlined in violet.

Finance · consumer lender · mid-size

Credit decisions that are faster, fairer and explainable.

Problem
Manual credit review was slow, inconsistent between analysts and hard to explain to the regulator.
What we did
Statistical credit-risk model with explainable features, fairness testing across protected groups and monitoring for drift.
Result
Decision time from three days to under an hour. Default rate unchanged; approval gap between groups reduced.
A black plate carved with lavender topographic contour lines and a few small pins; one contour line is highlighted in violet.

Public sector · city administration · 300 buildings

Energy use mapped, forecast and brought down.

Problem
Energy costs and emissions across public buildings were tracked only as annual totals, so nobody knew where to act.
What we did
Consolidated meter data, built a consumption baseline for every building, flagged anomalies and ranked retrofit candidates by impact.
Result
Energy use down 12% in two years. Retrofit budget directed to the 40 buildings with the highest return.

06 Industries

Industries we work in

Healthcare1 Finance2 Retail3 Public sector4 Non-profit5 Sustainability6

  1. Patient flow, readmission and clinical-risk models, privacy-compliant data.
  2. Credit and fraud risk, forecasting, explainable models for regulators.
  3. Demand forecasting, pricing, customer segmentation, churn.
  4. Service demand, resource allocation, open-data analysis.
  5. Impact measurement, donor analytics, programme evaluation.
  6. Energy and emissions baselines, climate-risk data, resource efficiency.
Dozens of small black spheres floating in a scatter-plot pattern in front of a lavender grid, with a straight violet regression line running through them.
Fig. 03 Every point counts. The line is earned.

07 About Statnu

Welcome to Statnu.

Statnu is a data science company that uses the power of data to solve the world’s most pressing problems. We are a team of experts in mathematics, statistics and computer science who are passionate about using data to make a difference.

We believe that data is the new oil, and that it has the potential to transform the world. We are committed to using data to create a more just, equitable and sustainable world. Our team has a wealth of experience in healthcare, finance and retail, with a proven track record of using data to solve complex problems.

We are always looking for new ways to use data to make a difference.

Our team

Experts in mathematics, statistics, and computer science, passionate about using data to make a difference.

Data Scientists
Frame the problem and own the model end to end
Statisticians
Design the analysis and quantify uncertainty
Machine Learning Engineers
Build, test and deploy models at scale
Data Engineers
Pipelines, infrastructure and data quality
Research Analysts
Domain research and evaluation of impact

08 Questions

Before you ask.

Ask something else
What does Statnu do?

We are a data science company. We apply mathematics, statistics and computer science to complex real-world problems, from the first question to a model in production.

Which industries do you work in?

Mostly healthcare, finance and retail, where our track record is deepest. We also work with public-sector, non-profit and sustainability organisations.

How do you approach a project?

In five steps: understand, explore, model, validate, deliver. Each step ends with something you can review before we move on.

Do you build custom models?

Yes. Every model is built for the specific problem and data, tested on data it has never seen, and documented so your team can maintain it.

How can I work with Statnu?

Tell us about your data problem using the form below. We reply within one business day and sign a mutual NDA before any data is shared.

A vast dark plane under a black sky with a single black sphere on the horizon and a thin violet line rising from it like a data point marker.

09 Contact

Contact Statnu.

Tell us about your data problem. We’re always looking for new ways to use data to make a difference.

Talk to our data team